Cleveland manufacturing and office sectors see little light ahead

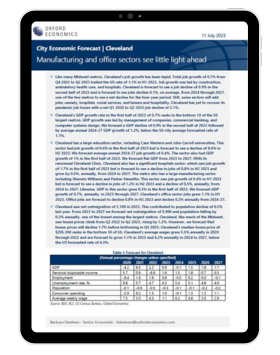
Like many Midwest metros, Cleveland’s job growth has been tepid. Total job growth of 0.7% from Q4 2022 to Q2 2023 trailed the US rate of 1.1% in H1 2023. Job growth was led by construction, ambulatory health care, and hospitals. Cleveland is forecast to see a job decline of 0.9% in the second half of 2023 and is forecast to see jobs decline 0.1%, on average, from 2024 through 2027, one of the few metros to see a net decline for the four-year period.
What you will learn:
- Cleveland’s GDP growth rate in the first half of 2023 of 0.7% ranks in the bottom 10 of the 50 largest metros. GDP growth was led by management of companies, commercial banking, and computer systems design. We forecast a GDP decline of 0.9% in the second half of 2023 followed by average annual 2024-27 GDP growth of 1.2%, below the 50-city average forecasted rate of 1.7%.
- Cleveland has a large education sector, including Case Western and John Carroll universities. This sector had job growth of 0.6% in the first half of 2023 but is forecast to see a decline of 0.6% in H2 2023. We forecast average annual 2024-27 job growth of 0.4%. The sector also had GDP growth of 1% in the first half of 2023. We forecast flat GDP from 2023 to 2027. With its renowned Cleveland Clinic, Cleveland also has a significant hospitals sector, which saw job growth of 1.7% in the first half of 2023 but is forecast to see a decline in jobs of 0.8% in H2 2023 and grow by 0.6%, annually, from 2024 to 2027.
- Cleveland saw net outmigration of 3,100 in 2022. This contributed to population decline of 0.5% last year. From 2023 to 2027 we forecast net outmigration of 9,900 and population falling by 0.2% annually, one of the lowest among the largest metros. Cleveland, like much of the Midwest, saw house prices climb from Q2 2022 to Q2 2023, rising by 1.2%.
Tags:
Related Services

Service
US States and Metro Service
Forecasts, scenarios and analysis for US states, metropolitan statistical areas and counties.
Find Out More
Service
City Climate Analysis
In-depth insights into the economic impacts of climate change and mitigation policies on cities and local economies throughout Europe, the US and Canada.
Find Out More
Service
Global Cities Service
Make decisions about market and investment strategies with historical data and forecasts for 1,000 of the world’s most important cities.
Find Out More