US States and Metro Service
Forecasts, scenarios and analysis for US states, metropolitan statistical areas and counties.
Try for free
Overview
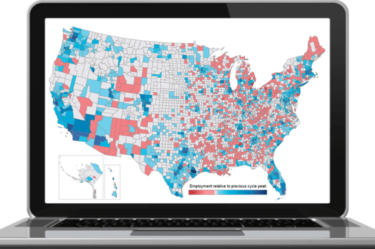
Our US states and metro service provides detailed data and forecasts for a broad range of economic, demographic and housing indicators. Three alternative scenarios to the baseline forecast quantify the upside and downside risks for each state and metropolitan area. The forecasts are accompanied by regular written analysis, webinars and support from our regional experts.
Detailed Insights
Sub-national data and forecasts across the US, covering all states, metropolitan areas and counties.

Long-term forecasts
All forecasts go forward to 2050 and are consistent with our global macroeconomic and industry views.

Regular updates and analysis
Quarterly updated data and forecasts, accompanied by written analysis highlighting key trends.

Enhanced industry data
Supplementary industry detail for all US states and 382 metropolitan areas.

Extensive datasets for each location
Data and forecasts for economic indicators such as GDP, employment, incomes and spending, demographics and the housing market.
Benefits of the service
An extensive dataset is available for each location, providing measures of economic performance and underlying growth drivers.

Reliable and consistent data
Our forecasts are derived from a consistent set of global economic, industry and city models and will help you make better decisions faster about market and investment strategies.

Advanced analytical functions
- The web-based application provides a variety of data selection and personalisation features.
- A simple but powerful add-in enables access to the data from directly within Excel.
- Output options include tables, charts, maps and external infographic tools such as Power BI. Data is also available via data feed and API tool.

Broad coverage
Data and forecasts are provided for a broad range of economic, demographic and housing indicators for each location, delivered via our web-based databank.
The service covers:
- 50 US states and District of Columbia
- 382 metropolitan areas
- 31 metro divisions
- 3,142 counties
Please fill out the form below to request more information about the service and its coverage.

“We were drawn to working with Oxford Economics for its solid reputation and the strength of its research, and we’ve been particularly impressed with your ability to present this to governments and the media – it’s the reason we’d look for future opportunities to work together.”
Resources and events

Research Briefing
All US metros worse off from recent tariff announcements

Research Briefing
US tariffs drag on growth prospects for Asian cities

Research Briefing
Which regions are most exposed to the 25% automotive tariffs?

Research Briefing
Parsing US federal job cuts by metro

Webinar
Air travel recovery to resume in 2022 post-Omicron

Webinar
UK Outlook: How many times will the MPC hike in 2022?

Webinar
Has Asia’s inflation peaked?

Webinar
The transformation of Japan from a goods to capital exporter

Infographic: trends in office employment growth (2023-2027)
Featured
Request a Free Trial
Complete the form and we will contact you to set up your free trial. Please note that trials are only available for qualified users.
We are committed to protecting your right to privacy and ensuring the privacy and security of your personal information. We will not share your personal information with other individuals or organisations without your permission.
Sign up to our Resource Hub to download the latest and most popular reports.
Related services

Service
US Construction Service
A comprehensive five-year outlook for construction activity in the United States.
Find Out More
Service
US Forecasting Service
Access to short- and long-term analysis, scenarios and forecasts for the US economy.
Find Out More
Service
US Industry Service
Outlook for 261 detailed sectors in the NAICS classification.
Find Out MoreTrusted By


